
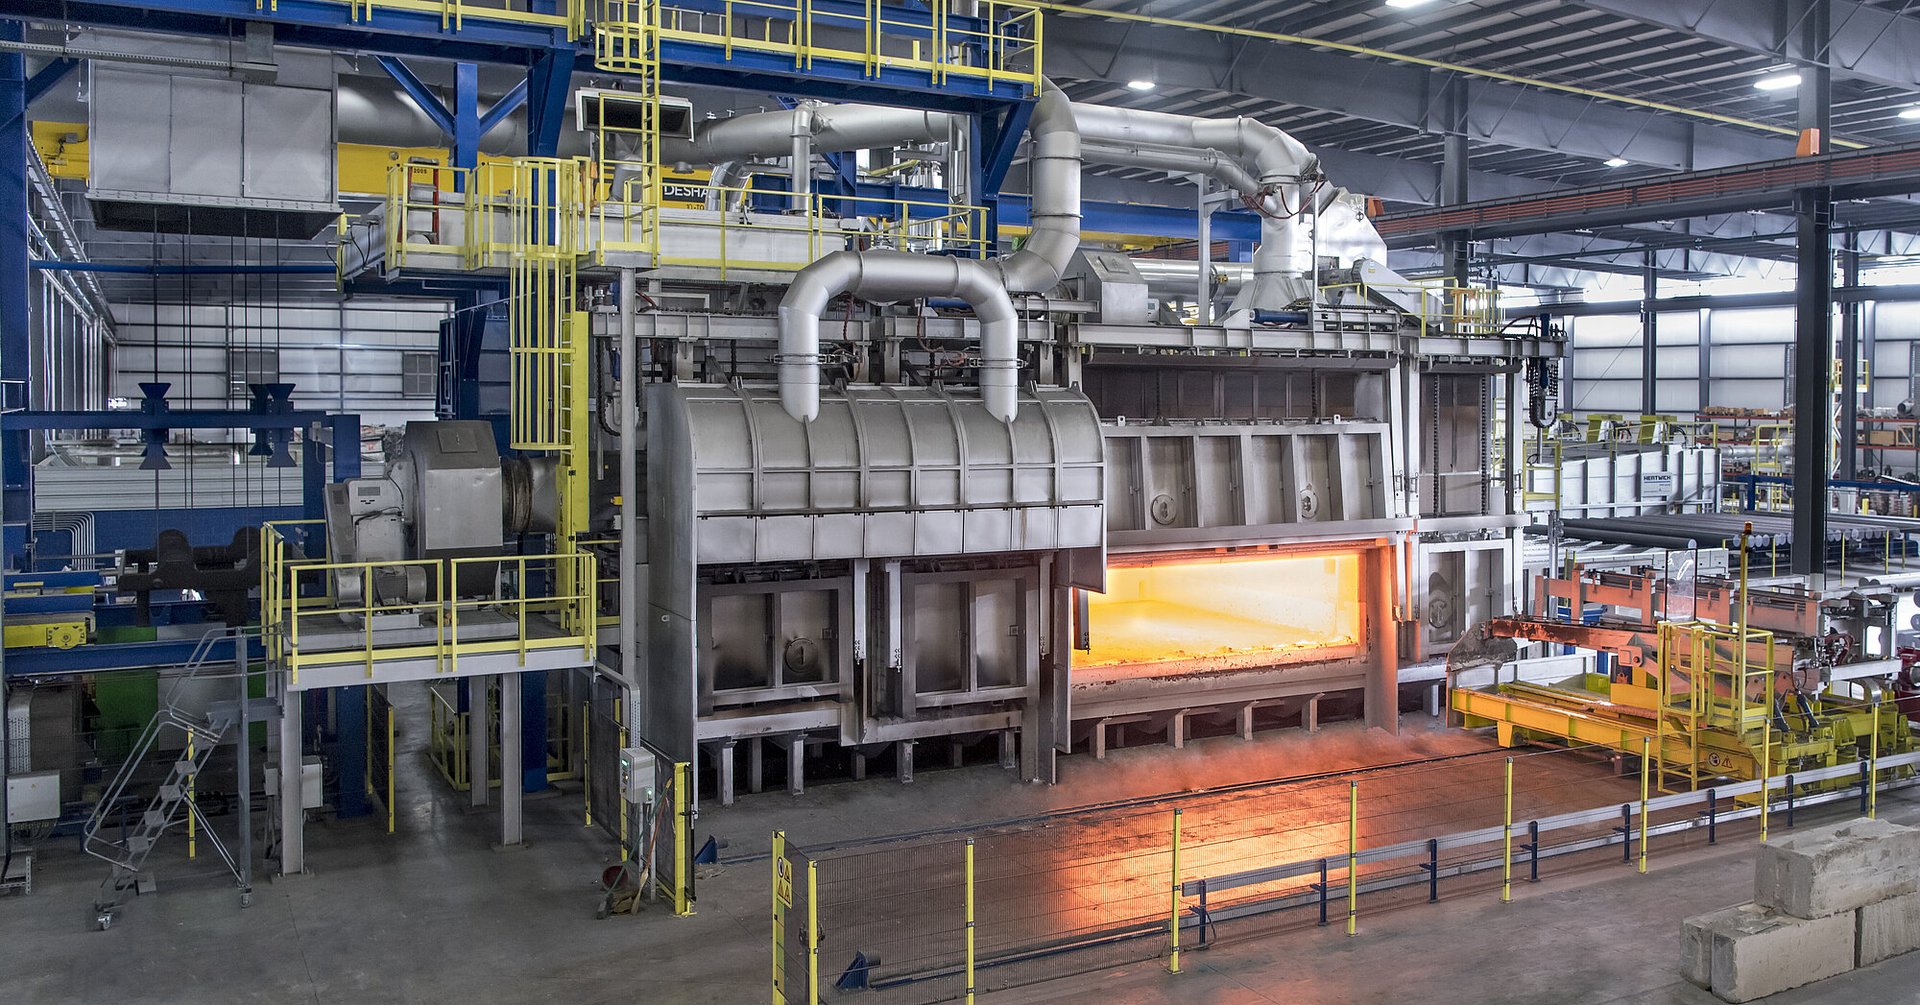
Waste to Energy Solutions
MRF
MRF
Information on the sources of MSW was provided by a number of EMB Regional Offices in addition to data from submitted SWM plans of the municipalities. The available information from 2008 to 2013 was synthesized and summarized in Figure 1.
MSW comes from residential, commercial, institutional and industrial sources. Residential waste constitutes the bulk (56.70%) of MSW and includes kitchen scraps, yard wastes, paper and cardboards, glass bottles, plastic containers and sando bags, foils, soiled tissues and diapers, and special wastes such as containers of household cleaning agents, batteries and waste electrical and electronic equipment (WEEE).
Commercial sources include commercial establishments, public and/or private markets which contribute 27.10% and some regions, about two- third (2/3) of commercial wastes come from the latter. Institutional sources such as government offices, educational and medical institutions account for about 12.10% while the remaining 4.10% are waste coming from the industrial or manufacturing sector.
Composition of Municipal Solid Waste
Information on the sources of MSW was provided by a number of EMB Regional Offices in addition to data from submitted SWM plans of the municipalities. The available information from 2008 to 2013 was synthesized and summarized in Figure 1.
MSW comes from residential, commercial, institutional and industrial sources. Residential waste constitutes the bulk (56.70%) of MSW and includes kitchen scraps, yard wastes, paper and cardboards, glass bottles, plastic containers and sando bags, foils, soiled tissues and diapers, and special wastes such as containers of household cleaning agents, batteries and waste electrical and electronic equipment (WEEE).
Commercial sources include commercial establishments, public and/or private markets which contribute 27.10% and some regions, about two- third (2/3) of commercial wastes come from the latter. Institutional sources such as government offices, educational and medical institutions account for about 12.10% while the remaining 4.10% are waste coming from the industrial or manufacturing sector.
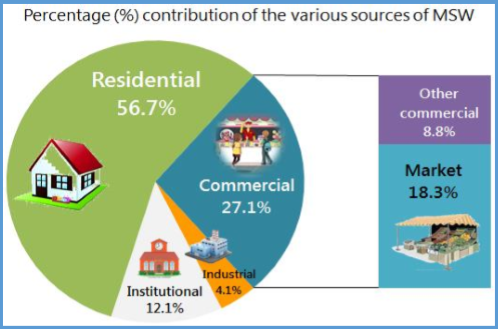
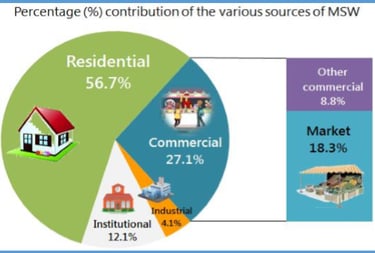
FIGURE 1 : Solid Waste Percentage
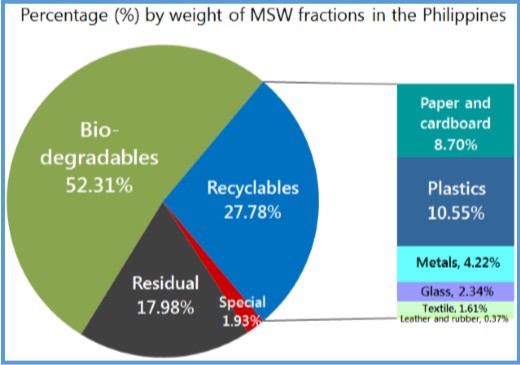
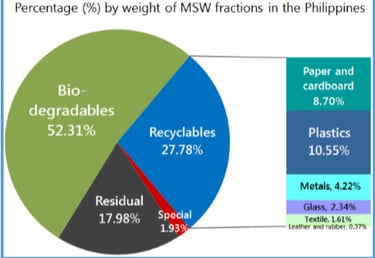
FIGURE 2 : Composition of municipal solid waste in the Philippines, 2008-2013
Biodegradable wastes
comprise about half (52.31%) of MSW although primary data suggest that figures can range from 30 to as much as 78%. Typical bio-waste consists of kitchen wastes and yard/garden wastes. From the available information, it could be estimated that 86.20% of compostable waste comes from kitchen scraps while 13.80% are leaves and twigs.
Recyclable wastes
account for almost a third (27.78%) of MSW with an estimated range of 4.1 to 53.30%. Plastic packaging materials comprise 38% of this waste fraction and followed by paper and cardboard wastes which contributes about 31%. The remaining 31% is made up of metals, glass, textile, leather and rubber.
Special wastes
which consist of household healthcare wastes, wastes from electrical and electronic equipment (WEEE), bulky waste and other hazardous materials contribute a measly 1.93% with values ranging from a negligible amount up to 9.20%.
Finally, residuals have been found to make up 17.98% of generated MSW. Most LGUs present this data as a combination of disposable wastes as well as inert materials, which comprise about 12% of the residual waste.
Target LGUs Waste Analysis:
Table 1. Waste Generation Rates and Projection
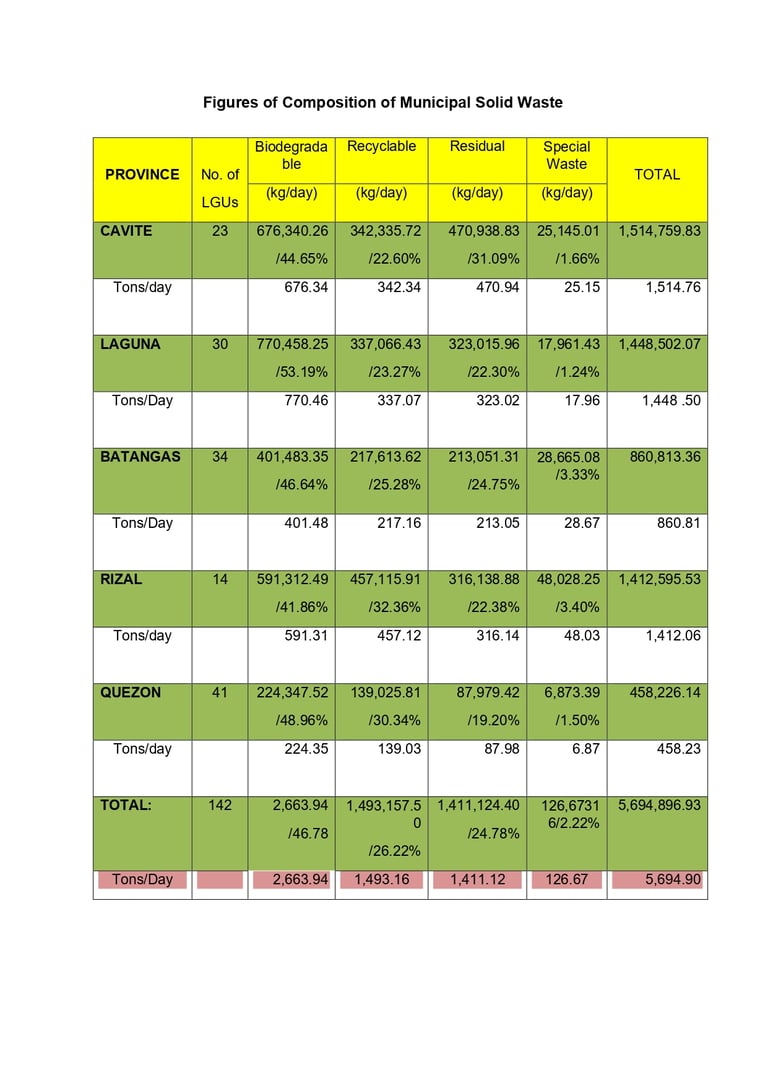
Waste generation rates have been estimated. For 2018, the average volume of wastes generated within the CALABARZON (Region 4-A) is about five thousand six hundred ninety four tons per day (5,694 tpd). This is based on the submitted 10-year plans submitted by the LGUs. Below is the breakdown of different categories of wastes based on the latest Waste Analysis and Characterization Study (WACS) of LGUs stated in their 10-year SWM plan.
Table 2. Waste Classification in CALABARZON
The bulk of waste generation is biodegradable wastes comprising 41.53% of the total waste generation. The special wastes have the smallest volume which is around 1.24 to 3.40%.
In terms of waste generation per capita, the average is 0.32 kg per person per day. Below is the waste generation per capita per province in the CALABARZON Region (Table 2). The province of Quezon has the smallest per capita waste generation in the region which is 0.19 kg per capita while the province of Cavite has the largest at 0.385 kg per capita of waste generation.
Table 3. Waste Generation per capita per Province in Region 4A (CALABARZON)

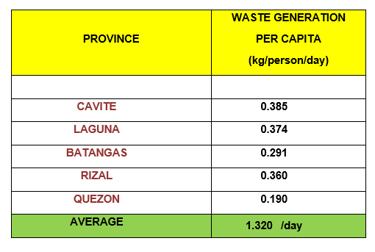
Table 4. Waste Characteristics and Stockpile Availability
Waste Analysis and Characterization Study Reports (WACS) of the target LGUs from the Environmental Management Bureau and other sources were secured. Waste generated data in 2017 were available and projections from 2018 to 2023 waste were taken from the report of National Solid Waste Management Commission based on WACS & EMB dated December 2015.
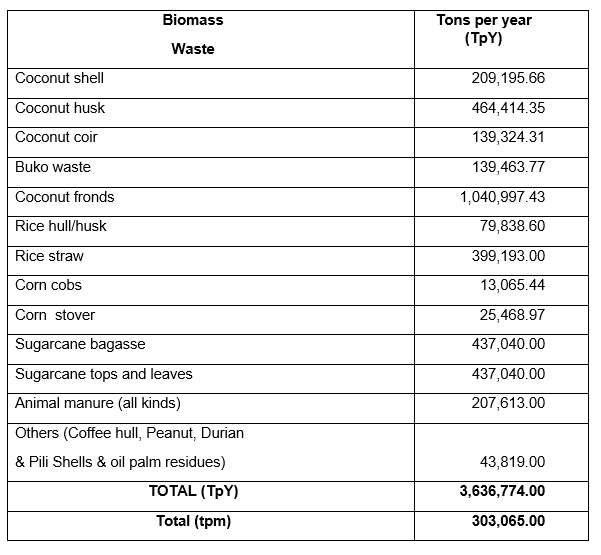
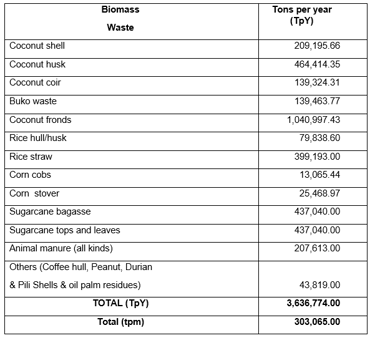
Figures 3 and 4 below show the data of generated wastes of all municipalities in the Province of Laguna, including nearby and adjacent municipalities and cities in the provinces of Batangas, Cavite, Rizal and adjacent municipalities and cities of Quezon. In addition, Baconguis and Pasagdan (2013) computed the agricultural and forest waste biomass (Table 3) for Region 4-A as shown below:
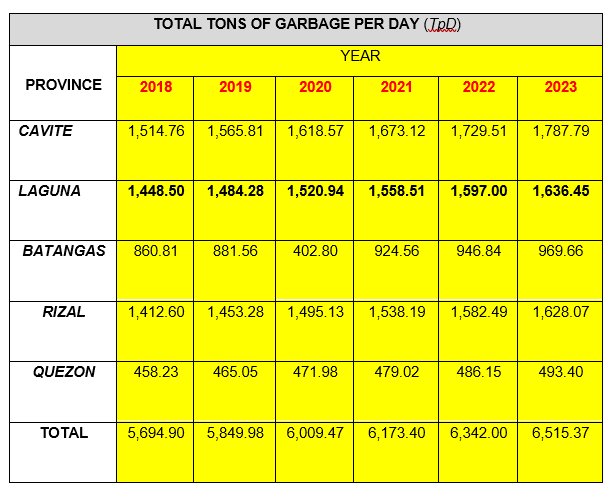
Table 5. Garbage Generation by Province in CALABARZON, Tons/day.

Waste biomass in Region 4-A (Baconguisand Pasagdan, 2013)
The Table 3 above shows the projection of waste generation per province from 2018 to 2023. Calculations were based on the Waste Analysis and Characterization Study (WACS) submitted by LGUs. The province of Cavite has the highest forecasted waste generation rate by year 2019 onwards. From among the five (5) provinces, Quezon has the lowest waste generation rate as forecasted in year 2019 and in the years to come.
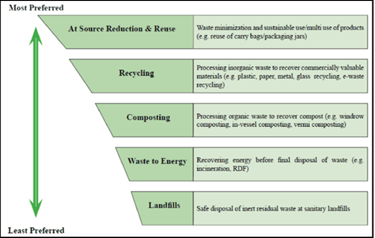
Based on the composition of MSW as shown in the tables/figures above, it describes the different options of various waste management choices from source reduction and reuse of waste to disposal of waste in landfill sites. The hierarchy is shown in Figure 3.
The waste analysis report clearly shows that waste generation will absolutely increase in the future. That may require a solution on how to manage this growing problem and WtE technology will provide a solution in absorbing all solid waste materials and convert it to electrical energy.
At Source Reduction and Reuse: The most preferred option for waste management in the MSW hierarchy is to prevent the generation of waste at various stages including the design of products, production, packaging, use and reuse of a product. Waste prevention helps to reduce handling, treatment, and disposal costs and reduces various environmental impacts such as leachate, bad odor, spread of insects/pests. air pollution and generation of greenhouse gases. Minimization of waste generation at source and reuse of products are the most preferred waste prevention strategies.
Figure 5. Hierarchy of Waste Management

Policy and Regulatory Requirements
Solid Waste Management is mainly governed by the R.A. 9003 and other related laws enacted and adopted in the Philippines. The respective LGUs need to formulate their own policies for successful implementation of R.A.9003.
The target LGUs that generate more than 1,500 TPD waste and manage such quantities of waste require integrated approach and technologies. Therefore, Maxi Energy is in the process of implementing processing facilities for treatment of wastes. There are several biological and thermal options available for treatment of MSW. These technologies are discussed in detail elsewhere in the document.
The waste processing technologies are important for overall waste management life cycle, its success is very much dependent on pre-stream management, i.e. waste segregation at source, collection, transportation and pre-treatment at Transfer Station and at the processing site. These basic requirements for waste management are detailed in the following sections.
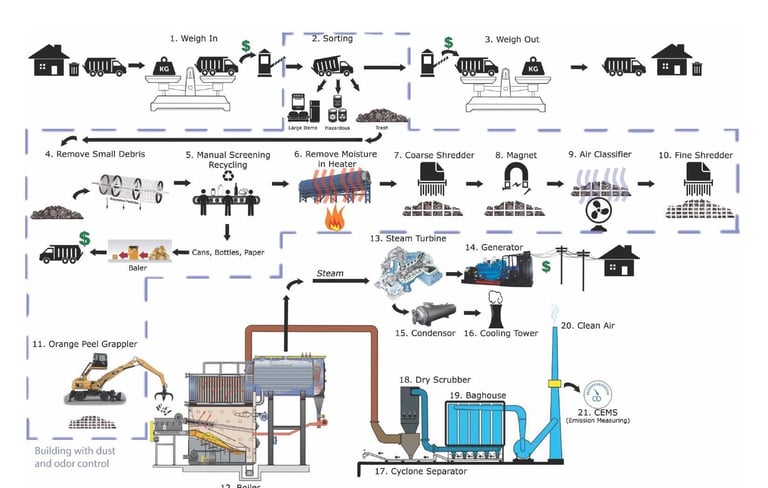
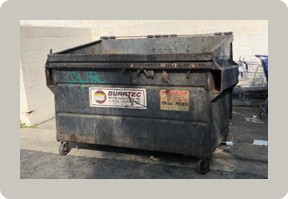
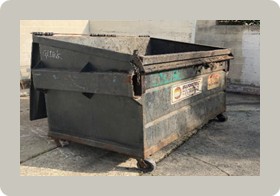
Source of Garbage: Source segregation is prerequisite for any waste management strategy. But in this project, garbage (segregated or not) from municipalities can be transported to the WTE facility for processing (RDF) and serve as feedstock to produce electricity. Consequently, ashes produced from combustion wastes may be used for construction, road-base, and the creation of products such as bricks, hollow blocks, etc. Implementation of this basic strategy will lead to considerable saving of energy in terms of transportation, handling and drying of waste.
Figure 6a and 6b, Compatible Trash Bins to Hauling Trucks


Transportation Strategy: The waste transportation is through covered dump trucks (Figure 5a and b) and other covered vehicles. The vehicles are provided with a leachate collector to prevent drippings to the roads that may leave a bad smell. Covered transportation not only helps in preventing unhygienic conditions during transportation, but also for preventing waste getting additional moisture due to its hydro-scoping/hygroscopic nature and rainfall.
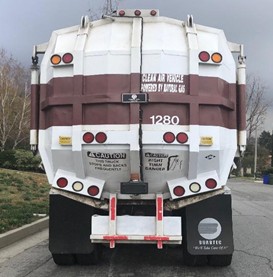
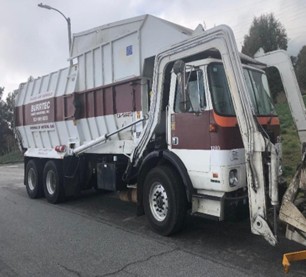

Figure 7a and 7b. Ideal Covered Truck for Waste
Transportation - The proper transportation strategy will also help in the ease of delivering the wastes to the WtE facility. This will save a considerable amount of transportation fuel and also save in energy for pre-processing of waste. Segregation of collected waste is done during the sorting process, inside the WtE facility, where large items are to be sent for recycling. Radioactive materials are detected at the facility entrance and treated separately. Inert materials can also be segregated during the sorting process and it can be disposed of or used separately, therefore saving on landfill area and energy consumption during pre-processing of wastes at the WtE facility.
Above MSW Philosophy is in line with R.A. 9003, R.A. 9513 and other guidelines. It will help in reducing the overall burden on landfill and reducing the existing landfill volume by way of collecting and using legacy wastes in the WtE plant. It will also help in cleaning waterways, improving water quality and reducing flooding by collecting garbage in rivers and canals by the community and transporting it to the WtE facility.

Get in touch
Feel free to contact us with any questions or concerns. You can use the form on our website or email us directly. We appreciate your interest and look forward to hearing from you.
Email:
Contact:
© 2026. All rights reserved.
Quick Links
Contact info
Location:
PHILIPPINES OFFICE
Corporate 145 Building, Unit 1415, Mother Ignacia Avenue, South Triangle, Quezon City, Philippines 1103
U.S.A OFFICE
325 S. Raymong Avenue, Suite C Alhambra, California 91803, United States of America
MAXI ENERGY USA is a private corporation company that specializes on Waste to Energy Conversion.
With our specialized allied professionals, our company consortiums give us advantage to continue developed our technology to meet the increasingly demand in Waste to Energy Processing.
✔ Waste to Energy Technology
✔ Sustainable Environmental Solutions
✔ Experienced Energy Specialists